Here are the results of the thermal images researchers took of many species of flowers:
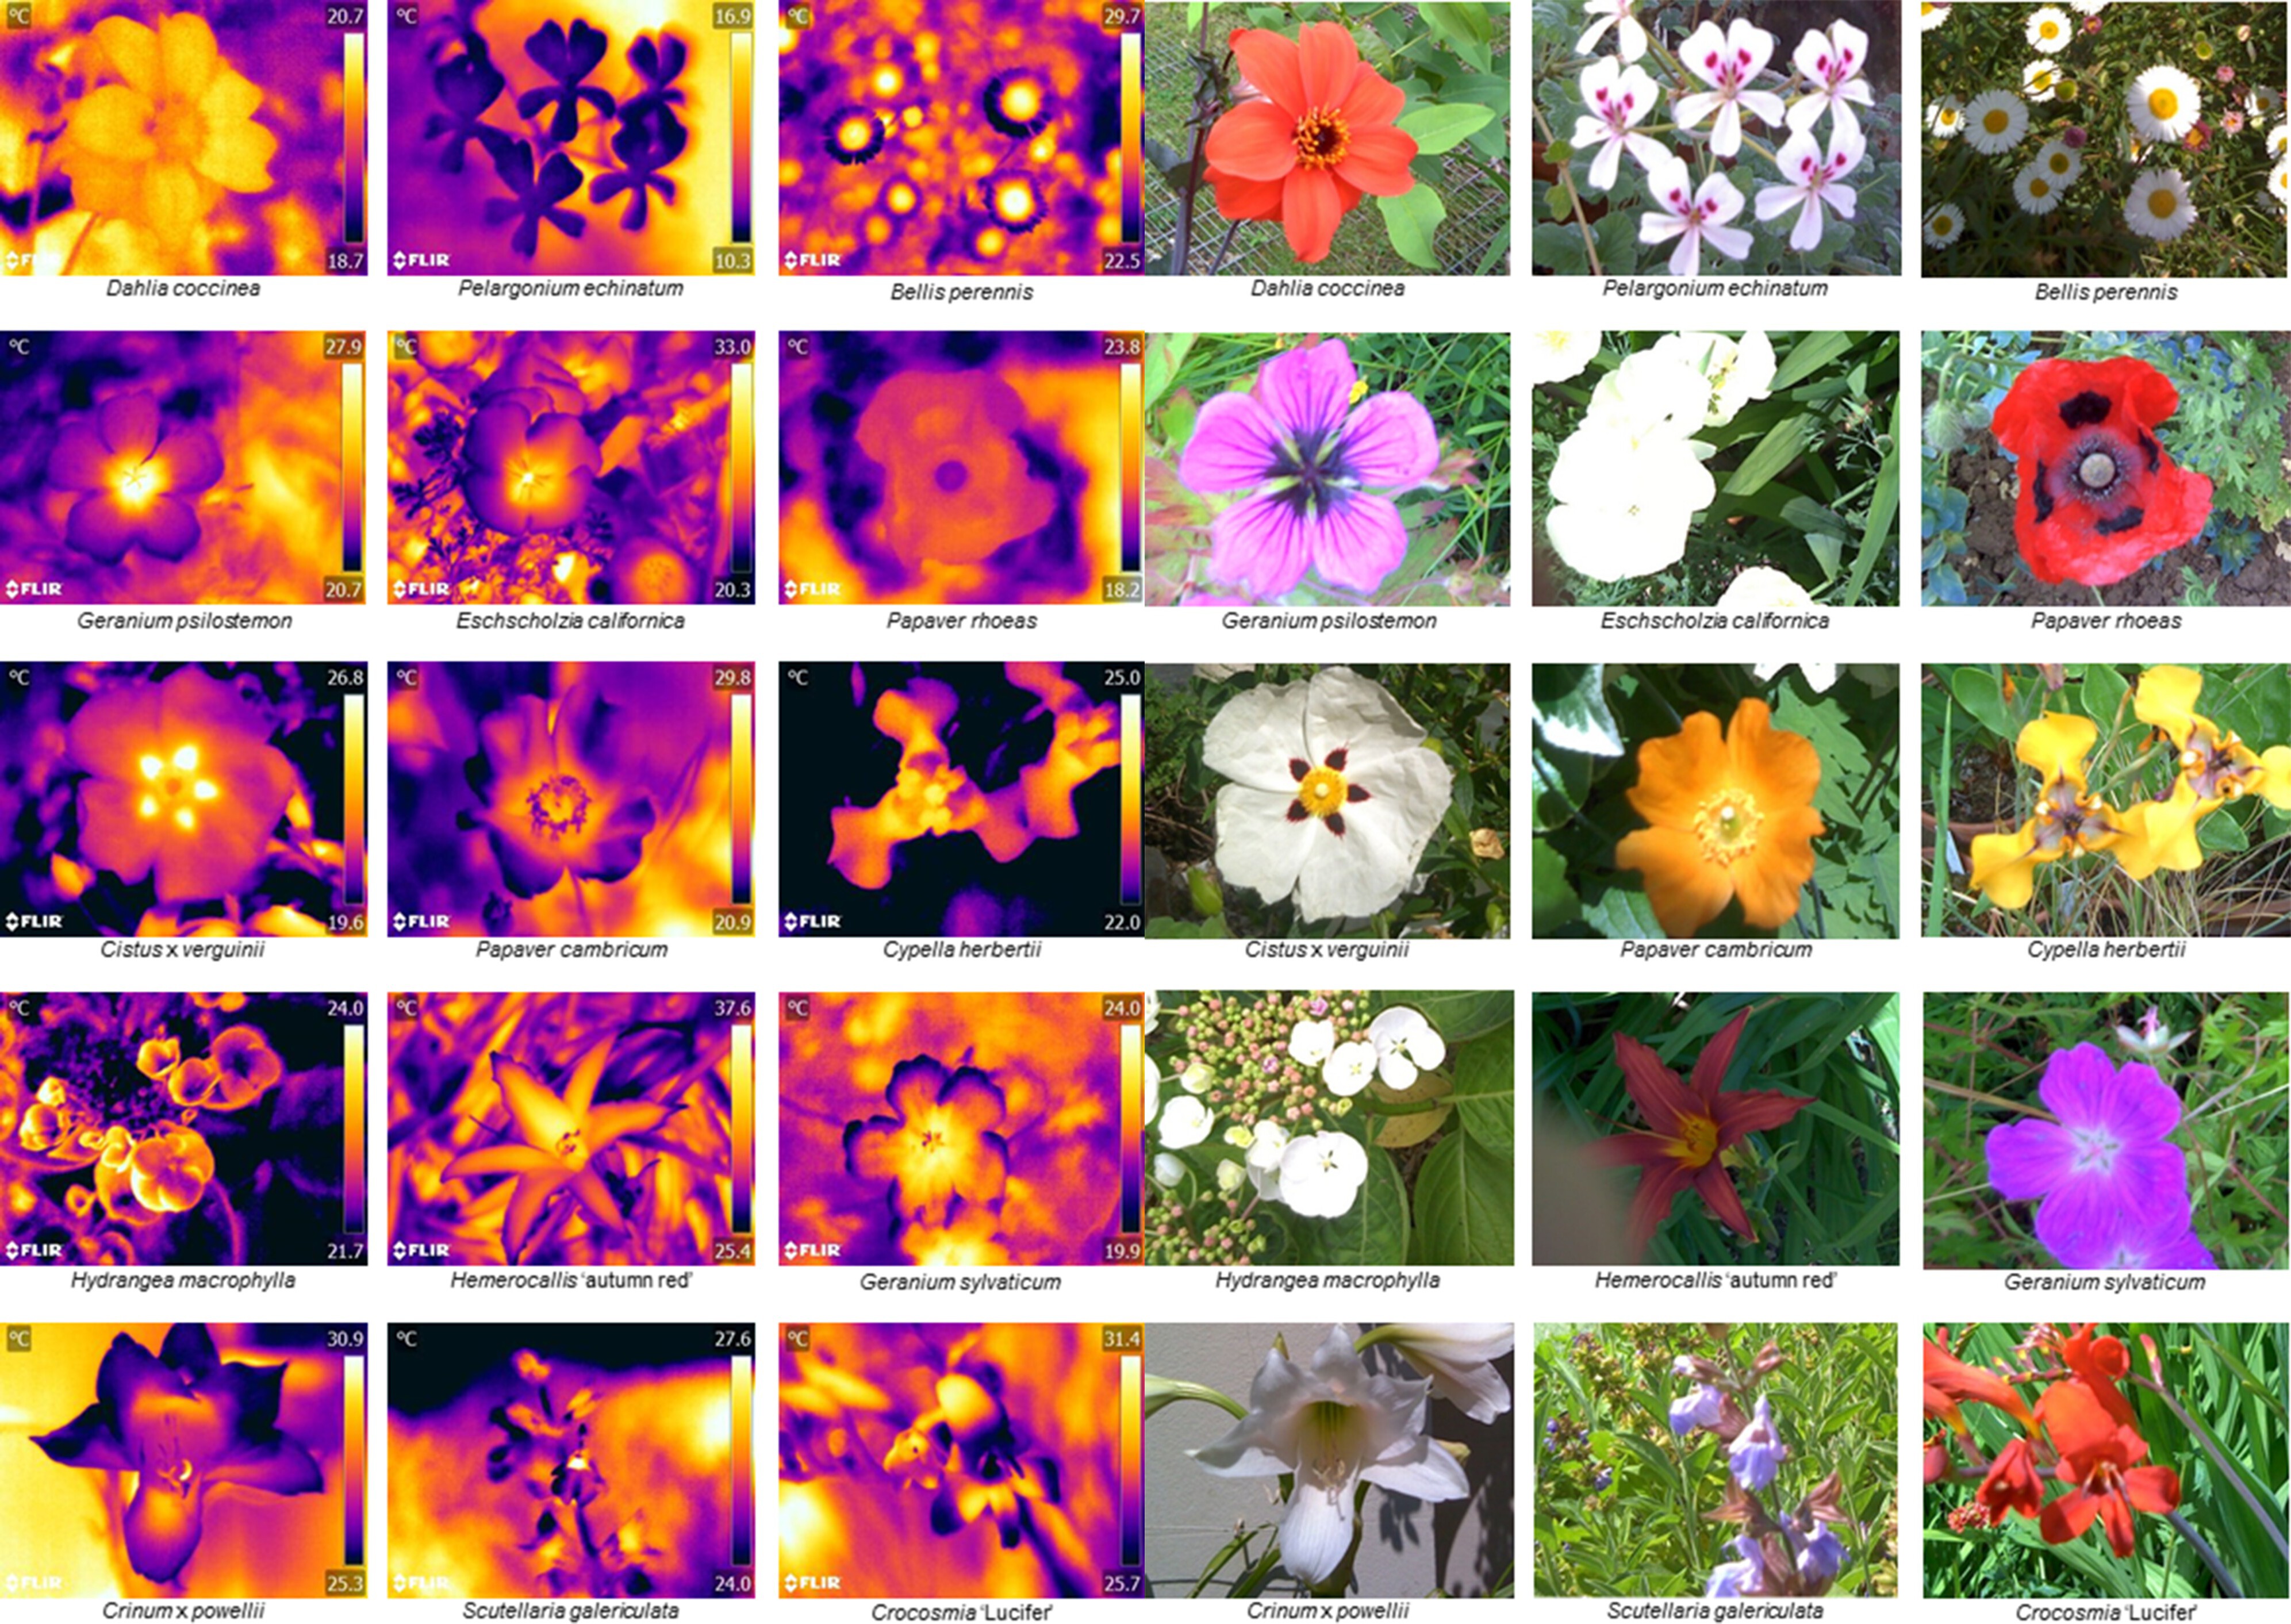
Thermal images (left) and digital images (right) of 15 flower species.
Q4: What flowers stick out as having a stong temperature pattern (having some part of the flower much hotter than other parts)?
We can clearly see from these images that some flowers have a large range of temperatures. Others have consistent temperatures. Let's look at a few examples from this figure. Dahlia coccinia (row 1, column 1) and Pelargonium echinatum (row1, column 2), have a consistent temperature and no thermal pattern. In contrast, Bellis perennis (row 1, column 3), has a clear thermal pattern. It's center is almost 5˚C hotter than the edges of the petals. Similarly, Cistus x virguinii (Row 3, column 1), has a hotter center than the edges of the petals. We can also easily see 5 hot spots in it's center, which match the maroon spots on the flower petals. This is a distinguishing characteristic, and could be used by bees to pick out this flower from a meadow. Finally, if we look at Crinum x powellii (row 5, column 1), we can see one petal is warmer than the other four. This petal is the "landing pad," the place bees should land on to easily pollinate. This landing pad being warmer could be a signal to a bee to land in that spot.
Q5: Hypothesize why the plant has a warmer landing pad? Why is it important that the bee land on the landing pad instead of on a different petal?
Flowers might want to specify where a pollinator would land, so the pollinator's weight is on a strong support. Otherwise, the flower might lose some petals or other parts unable to hold a pollinators weight. Another potential reason is that using the landing pad ensure the pollinator picks up some pollen, and if it landed somewhere else, it may be able to take nectar without picking up pollen. There are plenty of other potential reasons too!

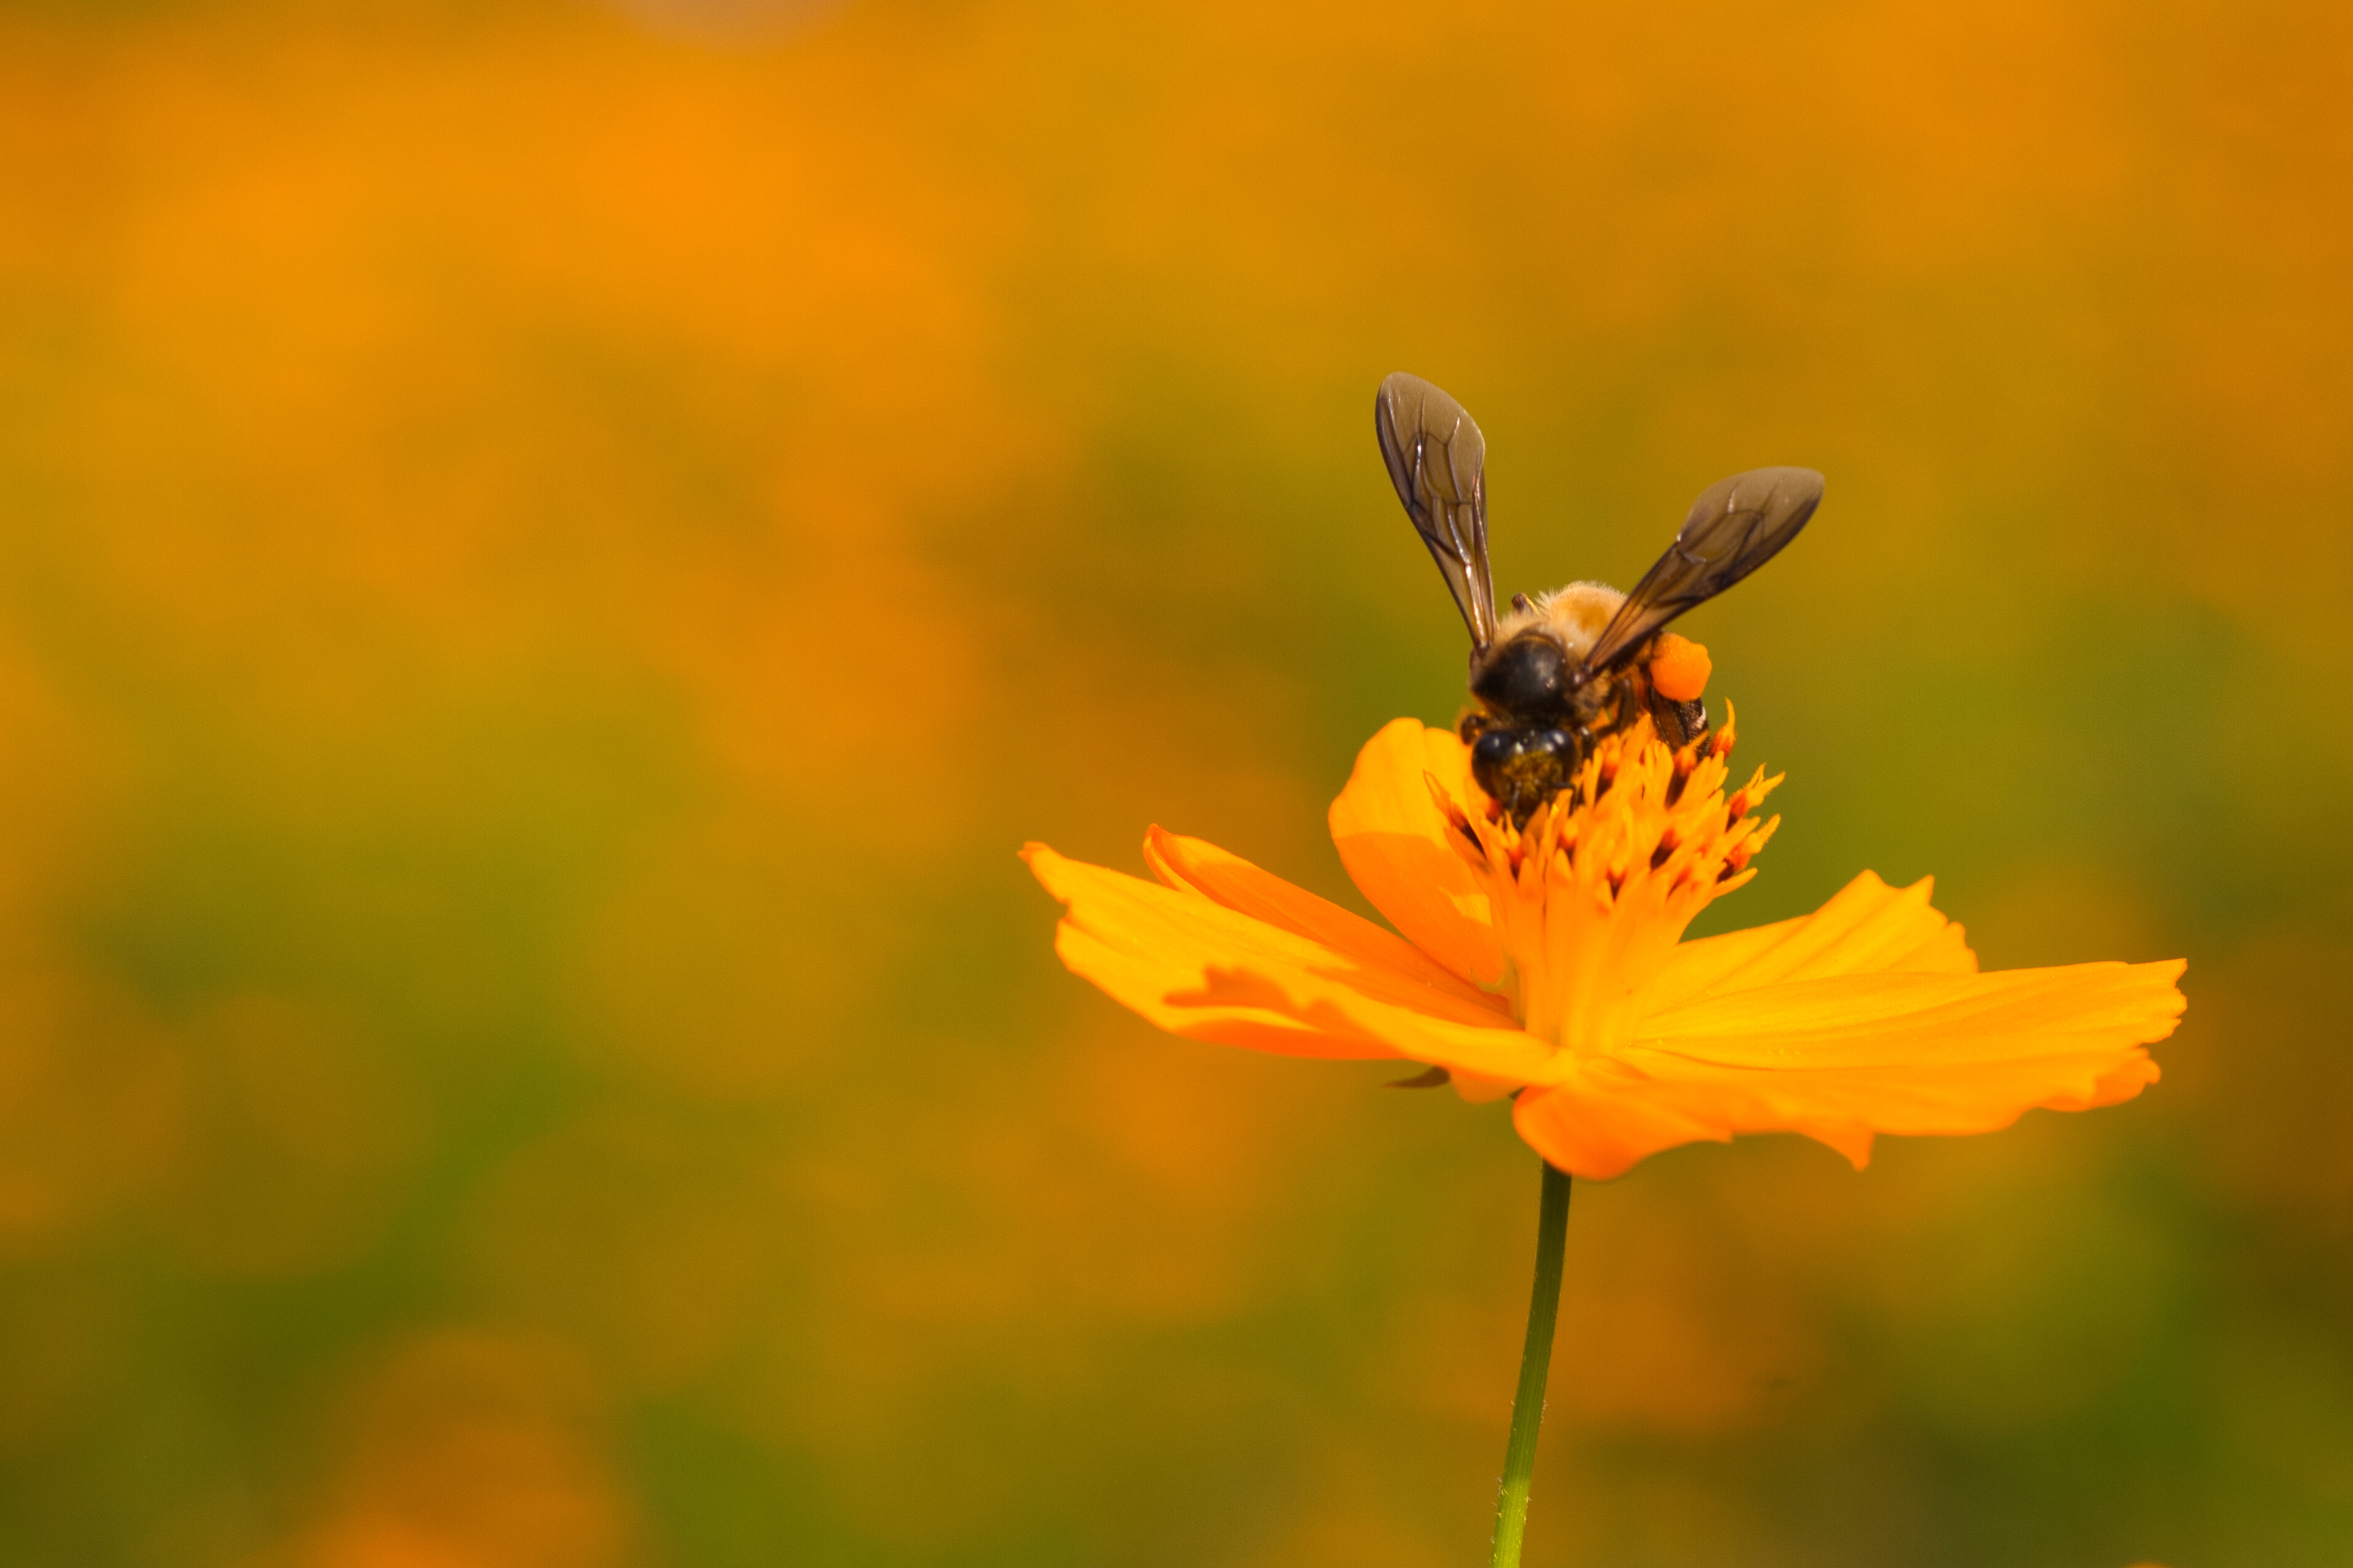
Bee standing on "landing pad" petal while pollinating.
Q6: What do you think makes some parts of a flower hotter than other parts? (Think of shape, color, wind, etc)
Researchers have previously found that bees can sense temperature differences of 2˚C and over. Of the flowers photographed in this study, 65 species (55%) had thermal patterns that bees would be able to sense. The average temperature difference in these 65 species was 4.89°C.
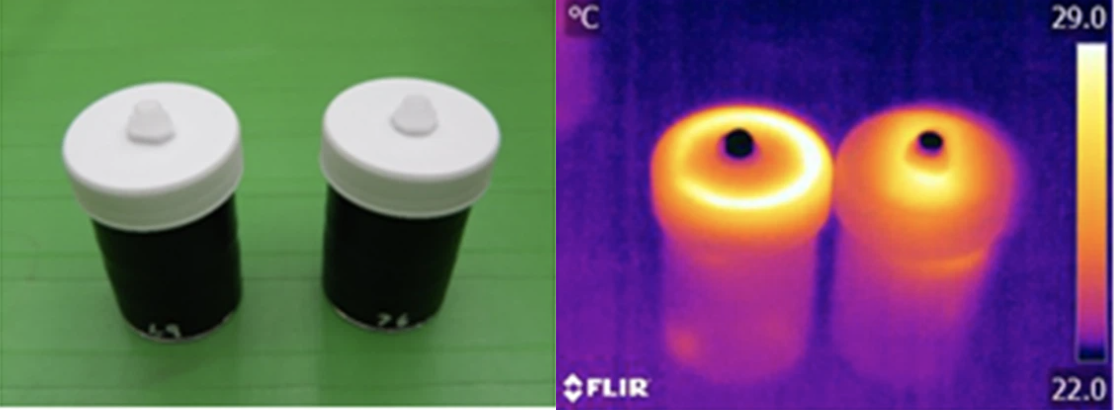
Once the researchers found that plenty of flowers have thermal patterns, they wanted to test whether bees use the thermal patterns. They first performed the tests for small flowers described in the 'Experiment' section of this page, and the results were as follows:
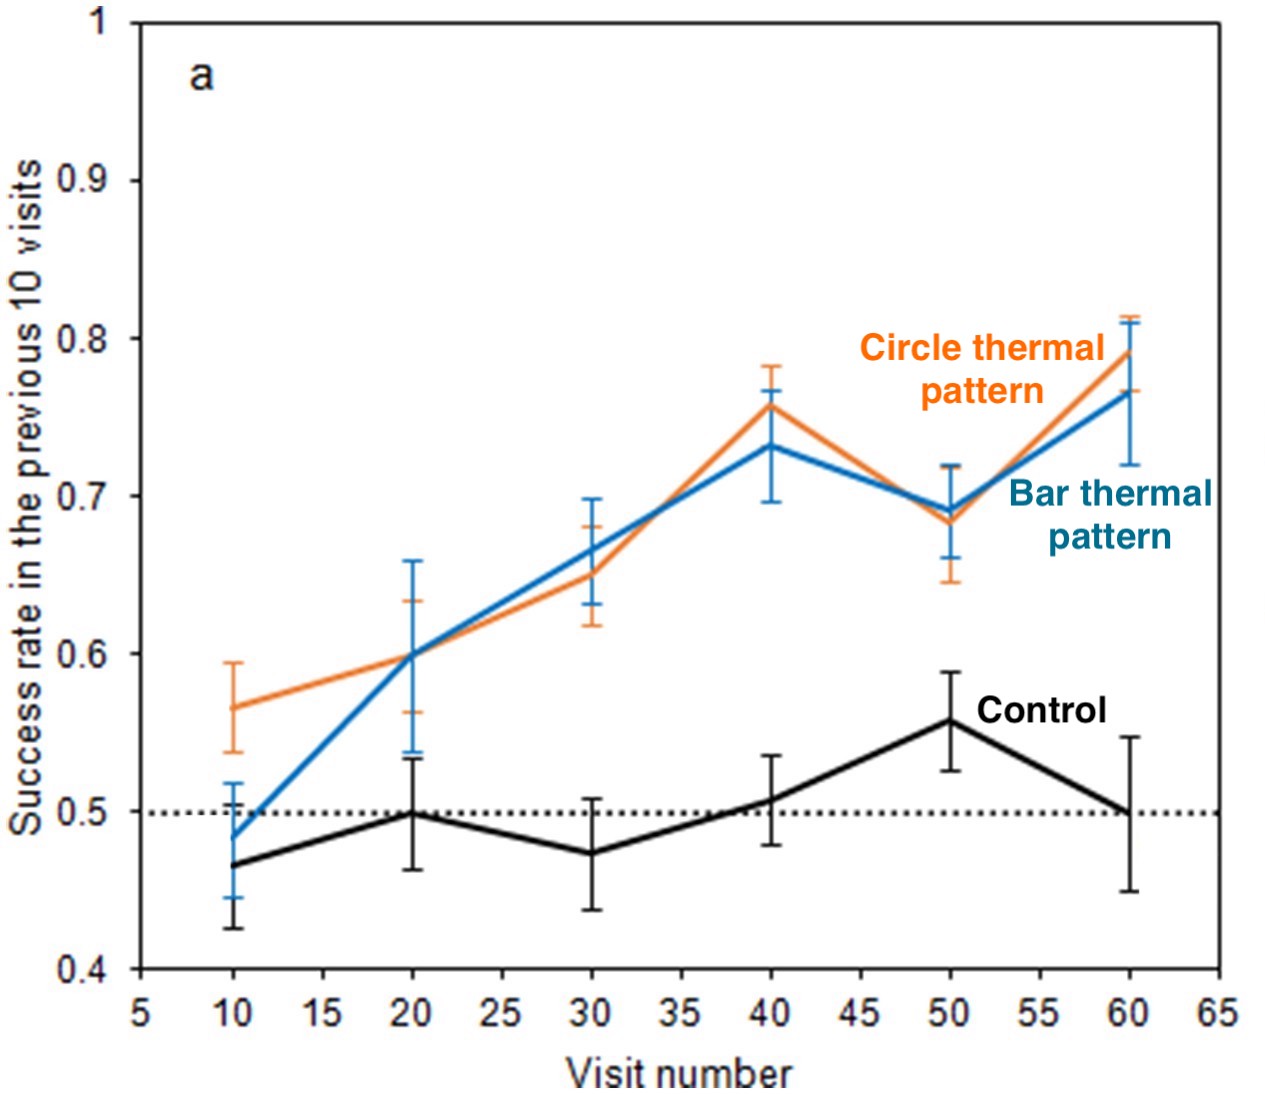
"Learning curve of bees visiting small artificial flowers." Foraging success of bees visiting small artificial flowers over number of flower visits. Dashed line indicates 50% success rate (visits each artificial flower equally). Black line indicates control group (no flower had a reward = should be near 50%). Blue line indicates foraging success when the bar thermal pattern had a reward and the orange line indicates foraging success when the circle thermal pattern had a reward.
The way we can understand this figure is: "if bees were able to learn that one thermal pattern has a reward, and the other thermal pattern doesn't, the blue and orange lines would both increase above 50%." This is because as the bees visited the flower with a reward and and the flower without a reward, they learned which thermal pattern had the reward, and so they began to visit that one more. From the figure, we see this is true. Both the blue and orange lines increase as bees visit the flowers. Thus, we can see that the bees were able to (1) recognize the thermal patterns and (2) make decisions based on the thermal patterns.
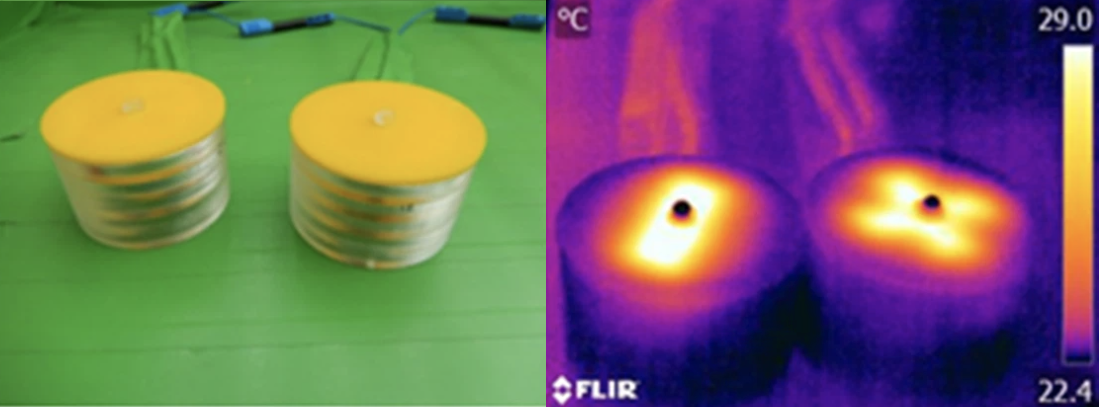
The researchers then repeated their tests using large flowers.
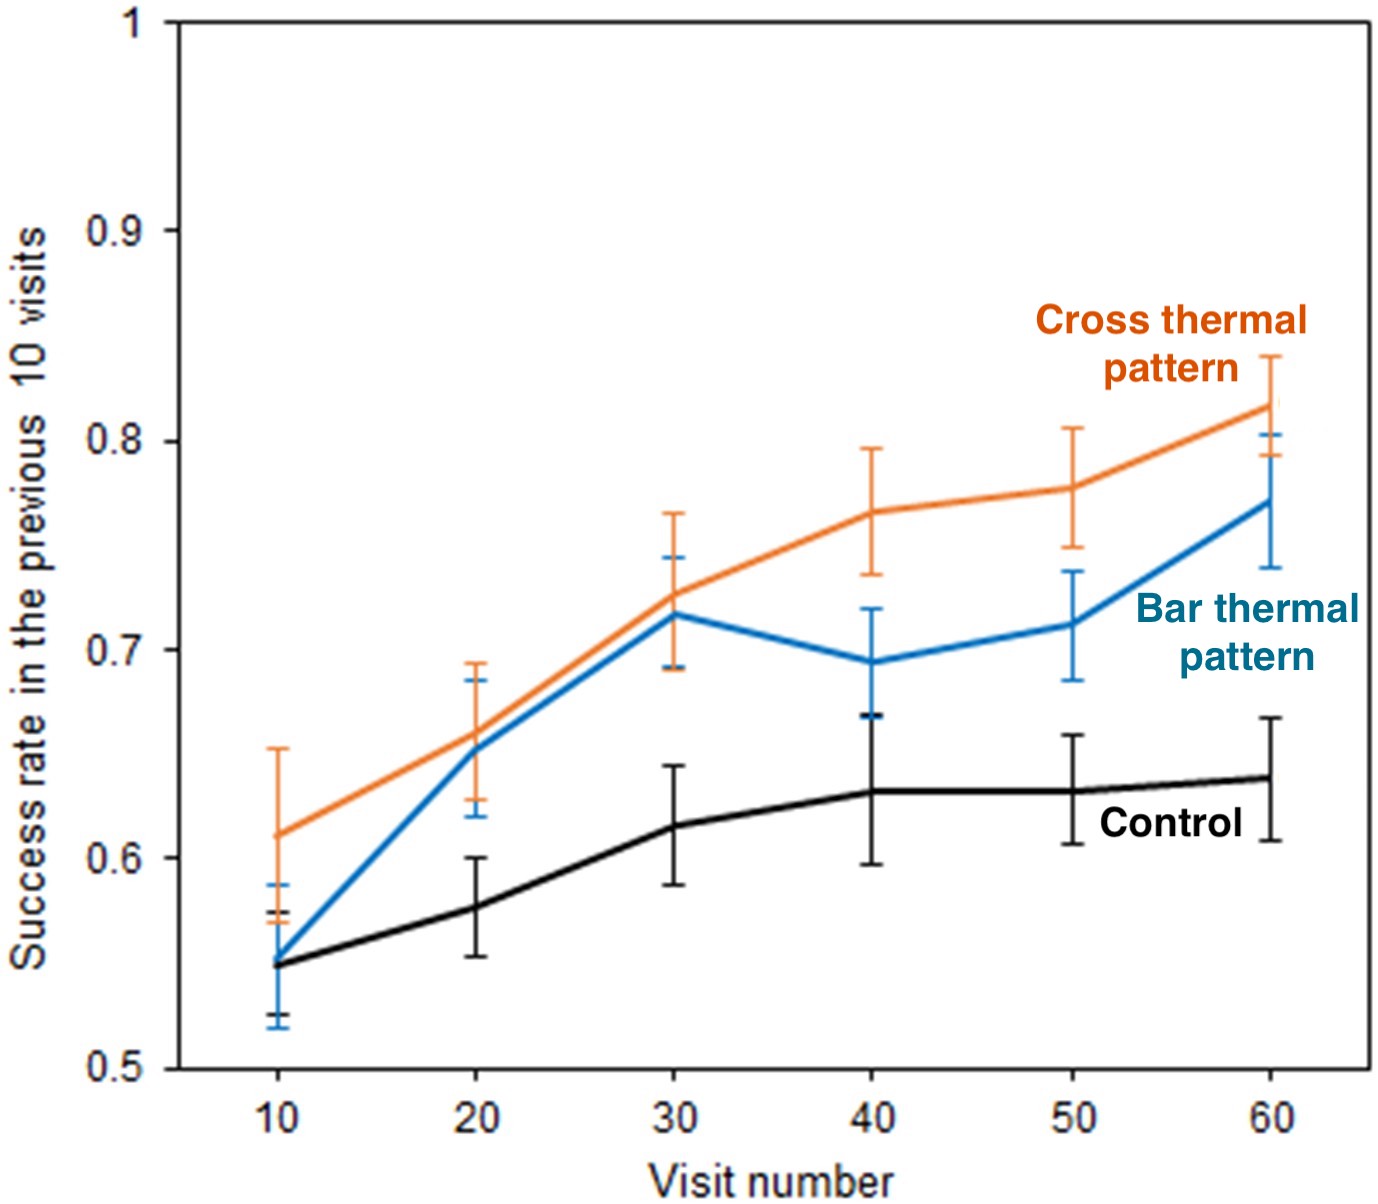
"Learning curve of bees visiting large artificial flowers." Foraging success of bees visiting large artificial flowers over number of flower visits. Black line indicates control group (no flower had a reward = should be near 50%). Blue line indicates foraging success when the bar thermal pattern had a reward and the orange line indicates foraging success when the cross thermal pattern had a reward.
We can understand this figure the same way as the previous figure. Again, we see the blue and orange lines increase as bees visit the large flowers. We can see that the bees were able to (1) recognize the thermal patterns and (2) make decisions based on the thermal patterns in large flowers.
From this study, researchers now know that thermal patterns on flowers can be sensed and used by pollinators. Bees are able to tell not only temperature changes, but the specific patterns of the temperature on the flower! They use this sense, and their other senses, to forage through the meadow for the best flowers to visit.