Thermograms
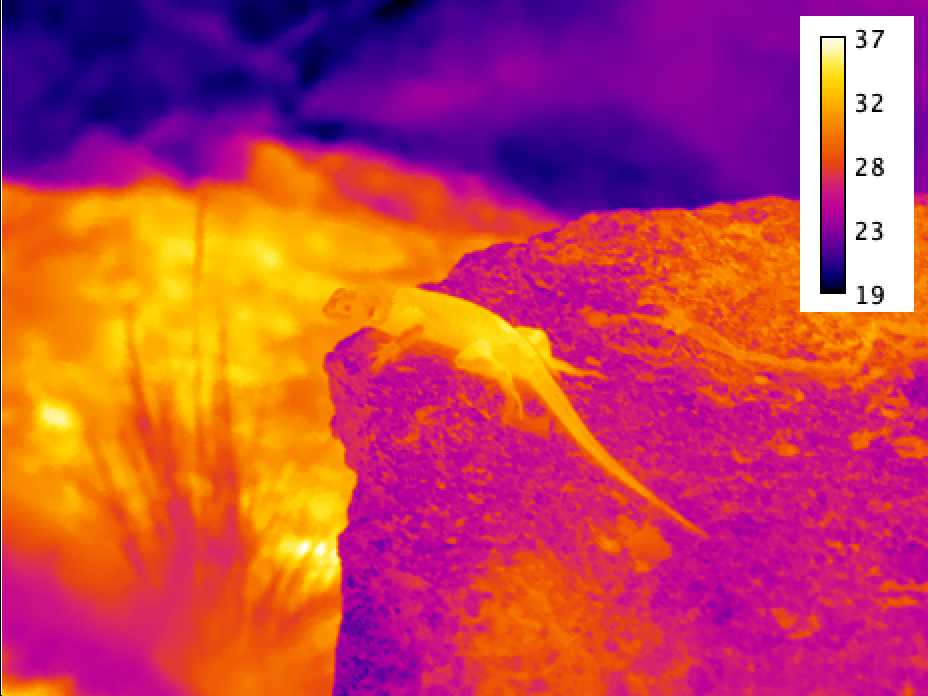
A thermogram is simply an image, impression, or visual representation of a scene's temperature. It is
the visual rendering of the energy emitted, transmitted, and reflected by an object and its environment.
All objects emit electromagnectic radiation from the random collision of matter, termed "radiant flux."
There is a strong positive relationship between an objects termpature and it's radiant flux, allowing
accurate radiometers to estimate object temperature. This calculation, however, depends on the emissivity
of the objects pictured.
Blackbodies and Radiation
An ideal blackbody is an object which absorbs all electromagnetic radiation at all wavelengths. It emits
energy at a maximum potential rate per unit area and unit wavelength at any temperature. No real objects
are true blackbodies, however this idealized object gives a baseline for comparisons. A blackbody's spectral
radiance, I, at a given wavelength and temperature is calculated using Planck's Law (h is the Planck constant,
k is the Boltzmann constant, and c is the speed of light):
=\frac{2hc^2}{\lambda^5}*\frac{1}{e^\frac{hc}{\lambda kT}-1}) .
.
This equation gives a resulting curvilinear relationship.

The peak occurs at a wavelength which we can use to solve
for blackbody temperature using Wein's law (b is Wein's displacement constant):

At a given wavelength, for biological surfaces, incoming radiation is either reflected or absorbed.
An ideal blackbody, which by definition absorbs all incoming radiation, emits radiation equivalent
to the amount of radiation absorbed.This is also means emittance and reflectance are inversely
related, or as Kirschoff's radiation law is summarized: “good absorbers are good emitters and
good reflectors are poor emitters.” A blackbody represents the upper limit of radiation emitted.
Stefan-Boltzmann's Law shows the relationship between the absolute temperature of the blackbody (T)
and the blackbody's radiant flux (Mb) as (given sigma as the Stefan-Boltzmann constant and A as the
surface area):

Now that we have data on blackbodies, the upper limit of emitted radiation, we can factor in emissivity,
which is the ratio of the body's radiant flux to that of a blackbody at the same temperature:

Emissivity is assumed for biological tissues as > 0.95.
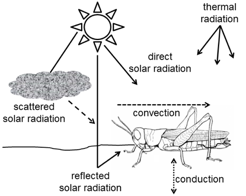
Since natural object do not behave exactly as blackbodies, background reflectance must be factored in.
Since reflectance = 1 - emittance, the absolute temperature (often air temperature) has a maximum error
of 1 - emittance, or about 5%. Atmospheric conditions (humidity) and distance from the imaged object also
impact the radiant energy detected. The longer the distance, the greater the atmospheric interference
due to the absorption of radiant energy by the water moledules. If a window is between the sensor and the
object, energy may be lost in transmission through the window, requiring estimation of tranmission levels
of the window materials and discouraging window use if possible. Finally, camera specs and stability
are factored into calibration of the signal based on the camera used.
Signal to temperature

The object's signal is first separated from the whole signal (in this case, no transmission window):

This showcases the need for accurate information on the environmental conditions the image was taken in.
The calibration of the camera empirically fits coefficients R, B, and F, and along with the signal s can
solve for temperature.
 ->
->